Usage
Instructions on how to use FLoRa.
Install FLoRa
This tutorial assumes that you have installed FLoRa successfully. If not, please check the Installation in the Getting Started guide first.
Run a simple simulation
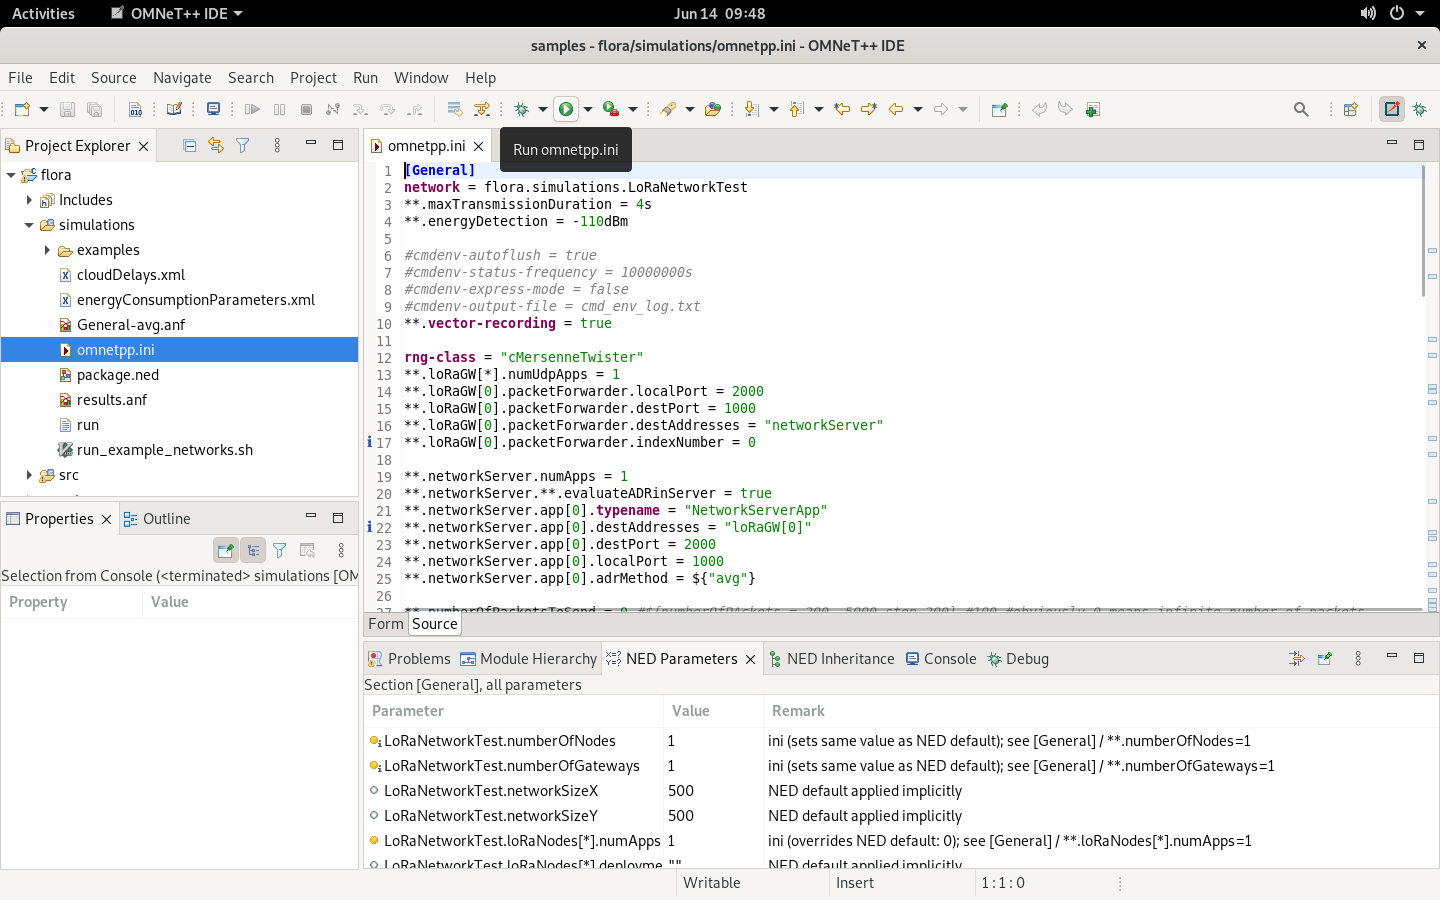
- On the left-hand side bar with the Project Explorer select omnetpp.ini (in this file you can configure many different simulation parameters), then click the Run button. If this is a first run, you will be asked to create a new configuration, you can just confirm it:
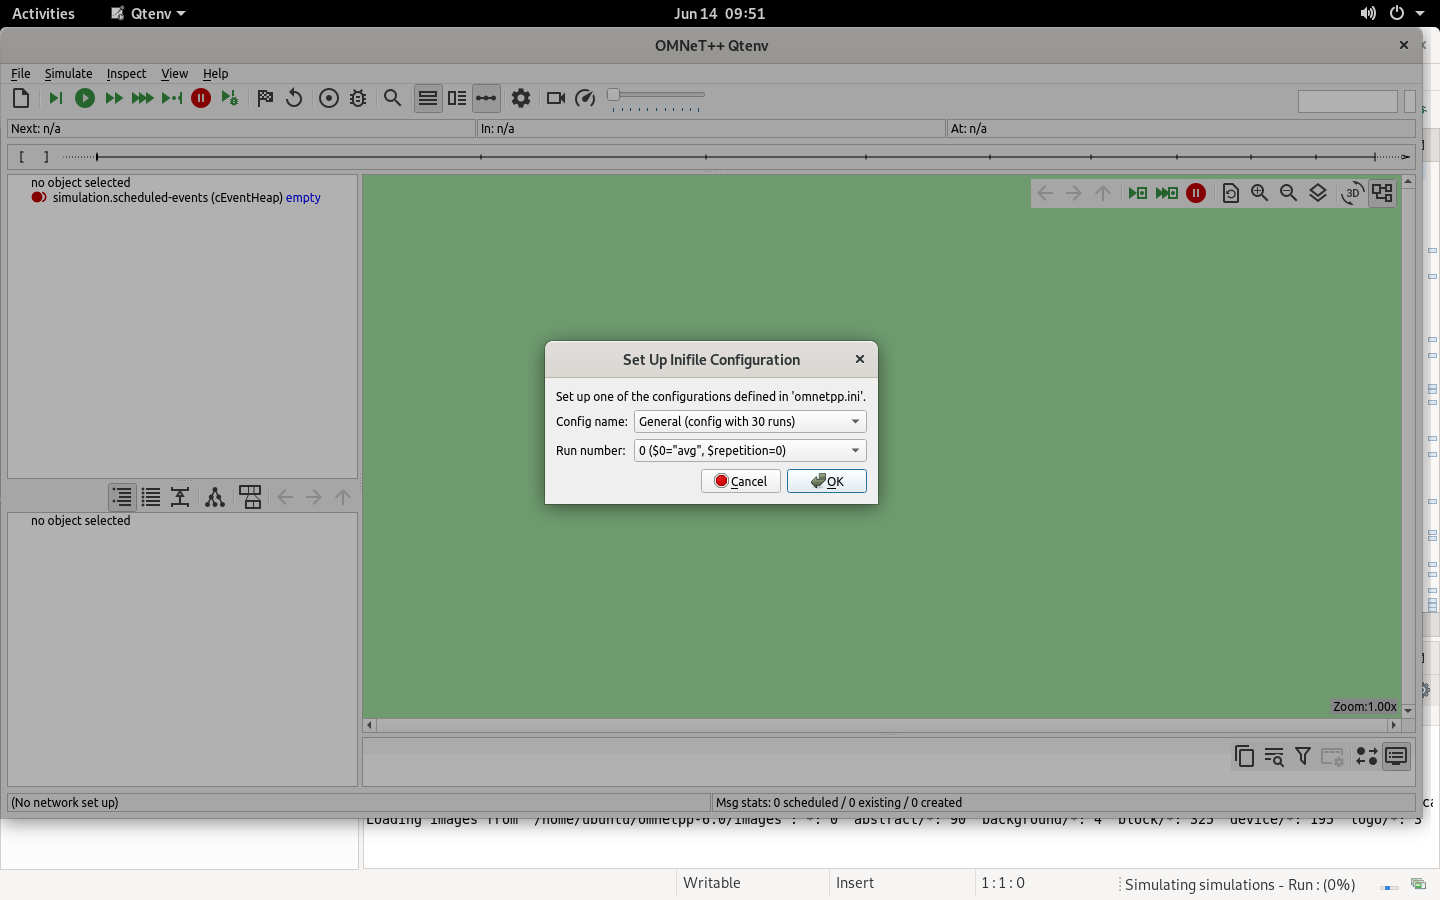
- After a while you will see that a simulation has started. The default configuration is fine, so you can just select the OK button:
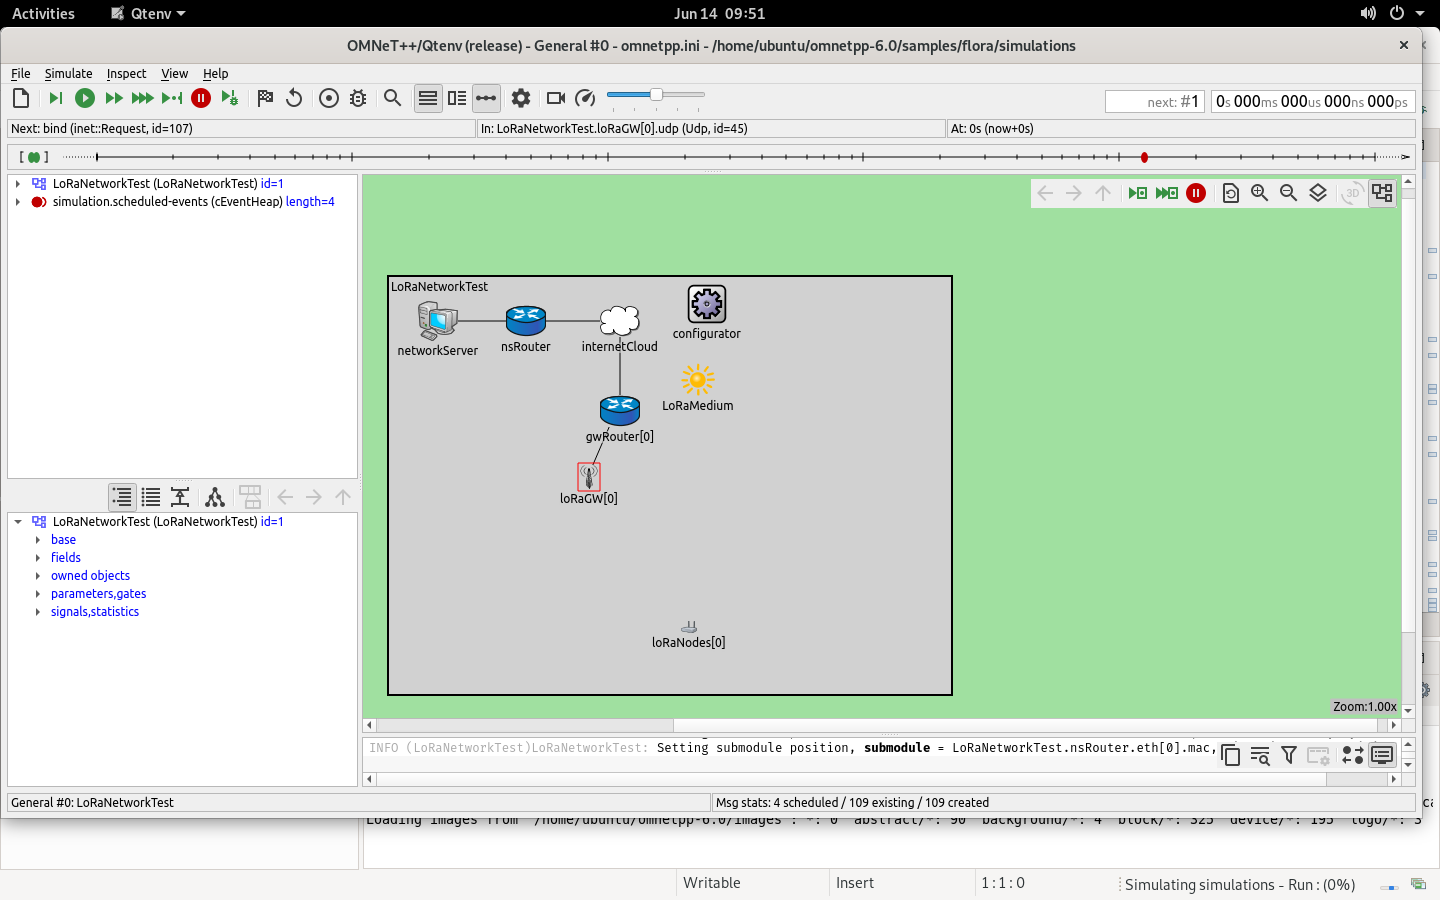
- At this point you can see the whole simulation setup. You can customize it by using tje Run button in the top bar. To run simulation without seeing the details on screen, just run Express mode (the icon with the three green triangles).
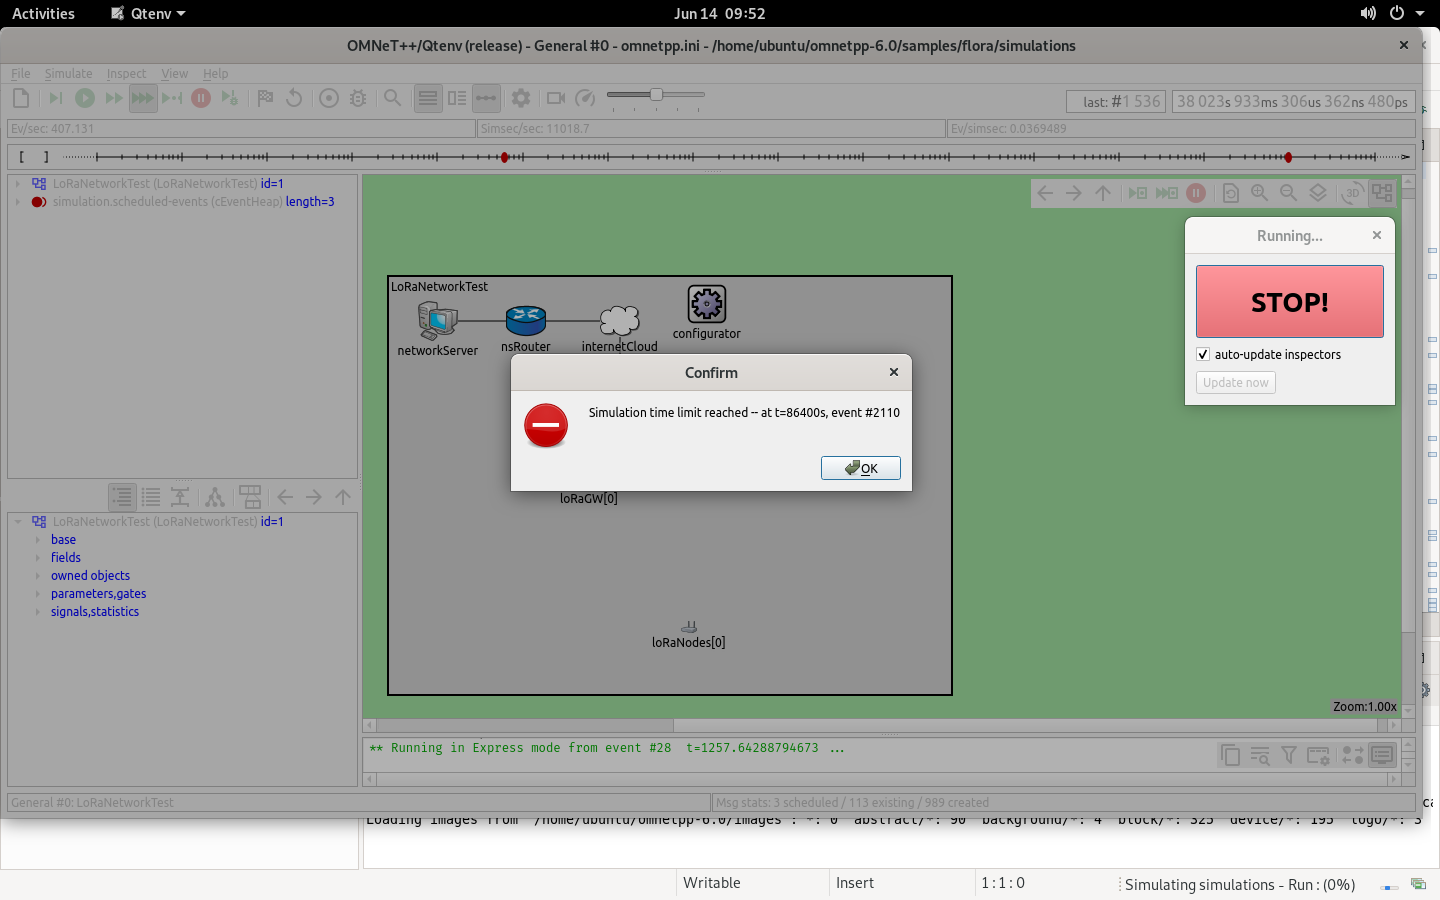
- After some time the simulation should be over. Click OK and close the simulation window when it is done:
Evaluate the simulation results
You can use a tool included in OMNeT++ to process the data generated during the simulation. To run it for a previously-started simulation, select the General-avg.inf file that can be found in the Project Explorer. Then, you can select different data that have been collected during simulation and check them in a graphical form by picking proper input data (you can just use the default ones). We present some sample data in the next section.
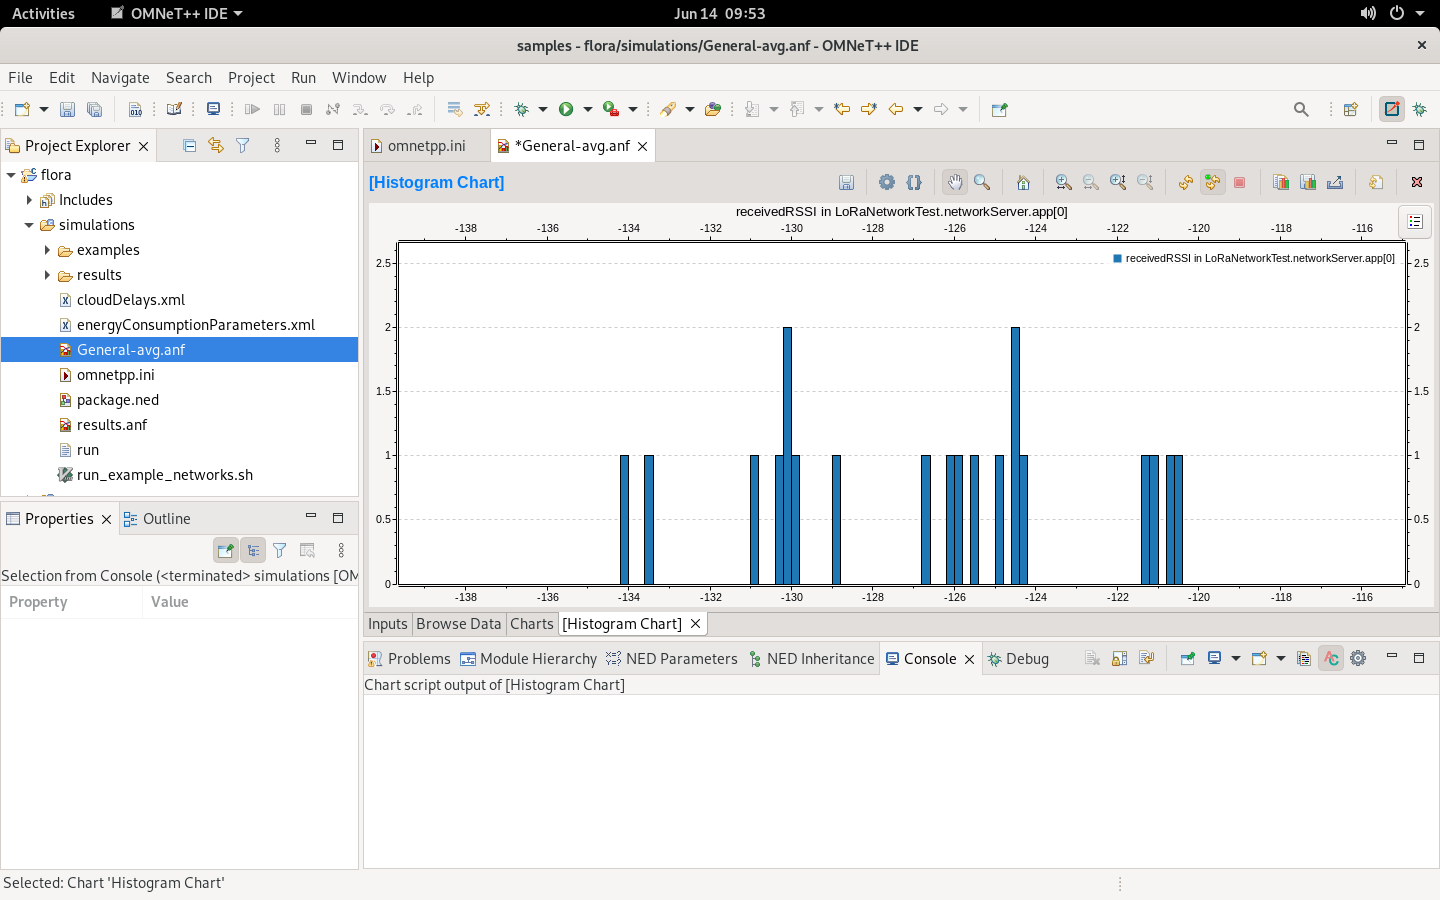
Histogram of RSSI values in packets collected by the network server
This is the representation of the data that collected by the Network Server, which can be used to evaluate the Adaptive Data Rate (ADR) mechanism.
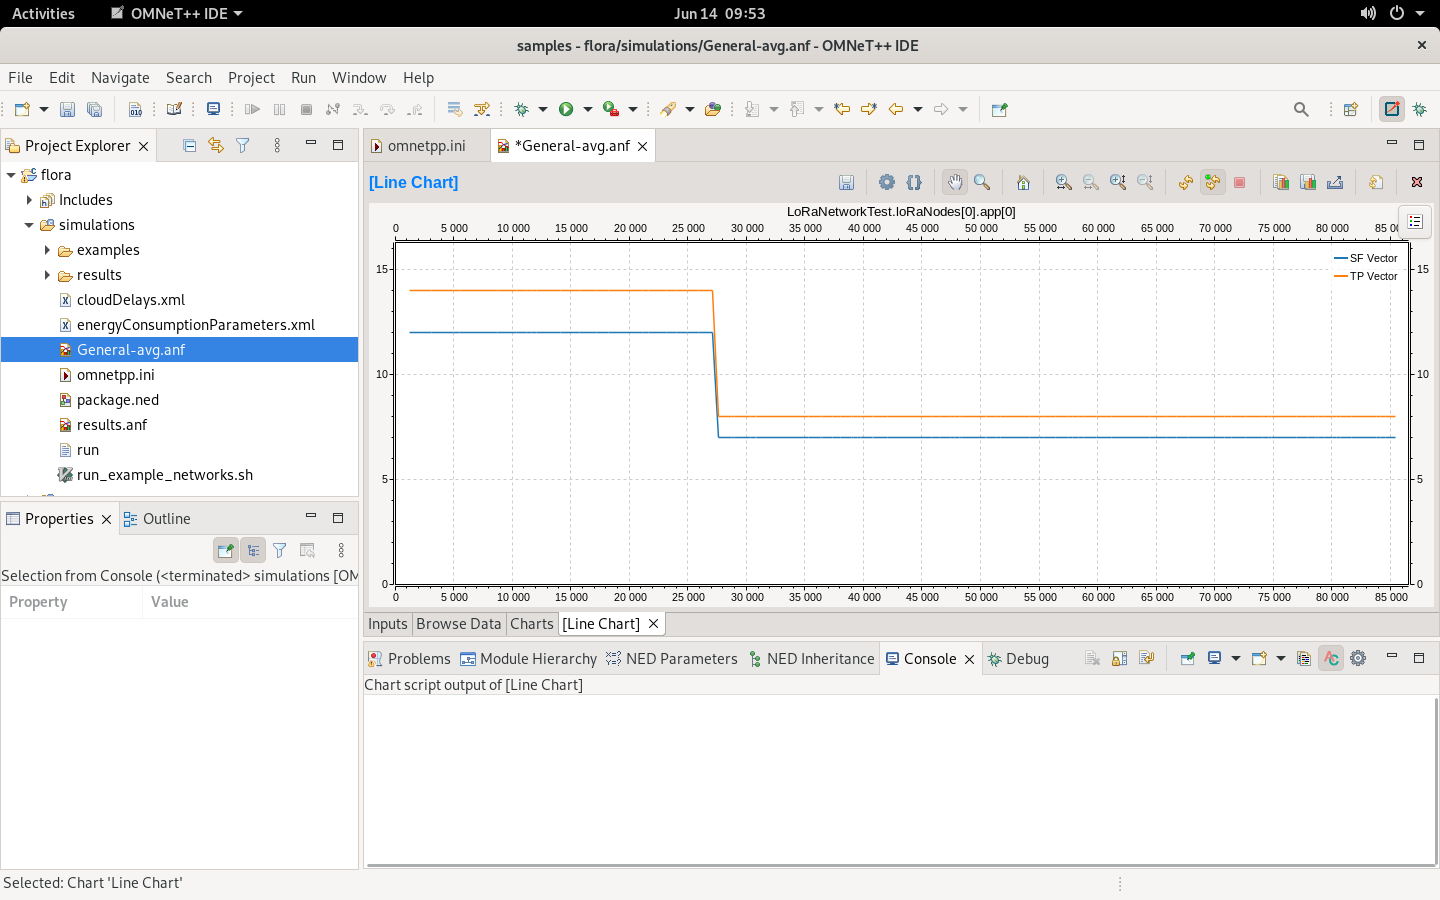
Spreading factor and transmission power of a LoRa end device
Here you can see that the ADR mechanism tuned both the spreading factor and the transmission power.
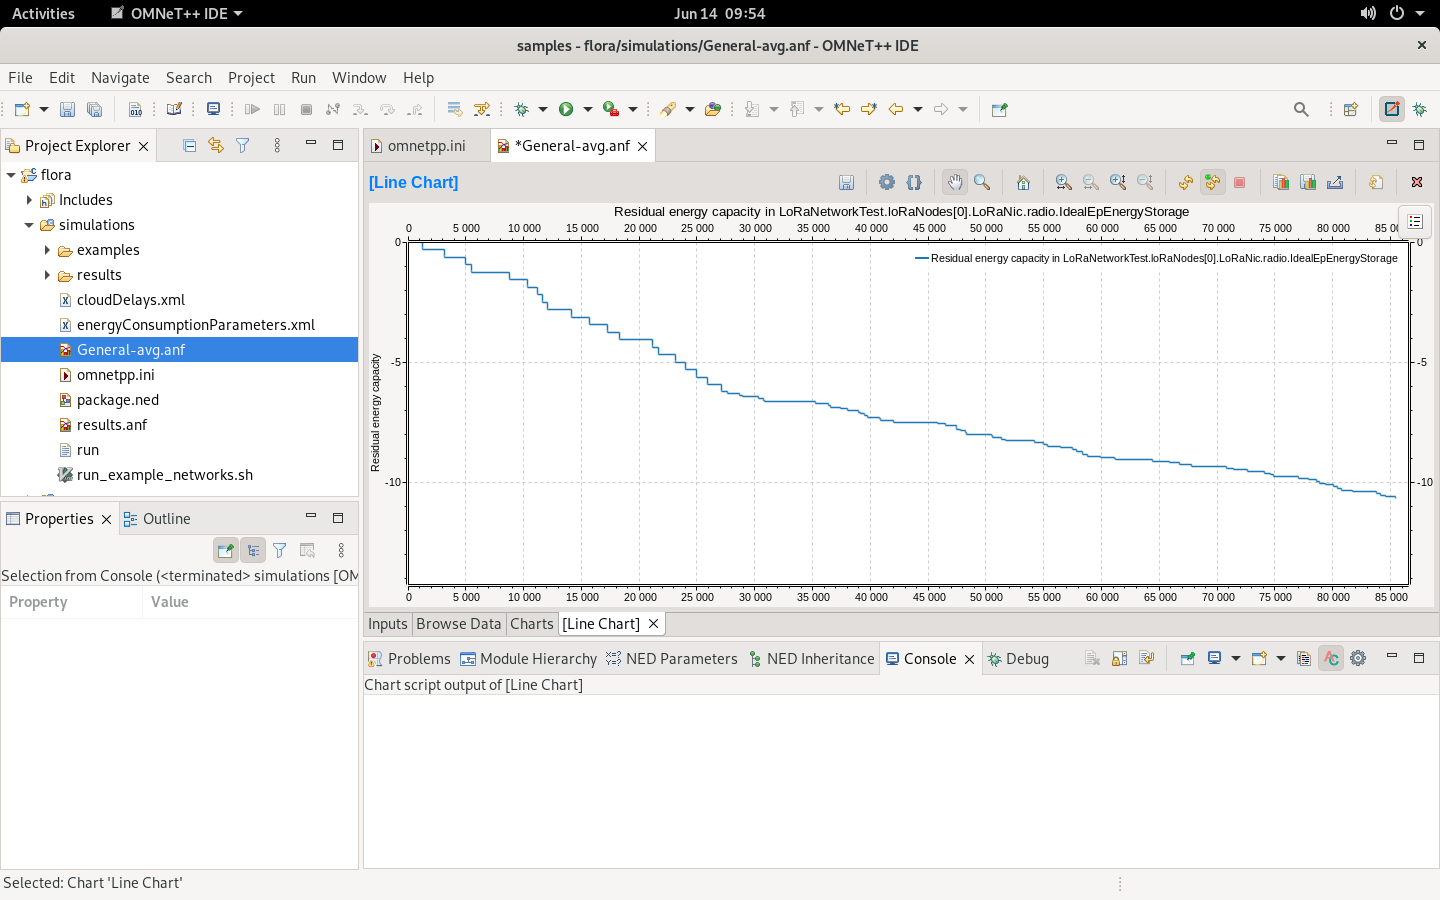
Energy consumed by a LoRa end device
The plot shows energy drained by using radio. You can correlate the slope with update of SF and TP presented above.
Final notes
This is just a simple example what you can simulate with FLoRa. Check the examples directory, where you can find .ini files with more complex simulations that we have used in one of our research articles.